What is Charts?

Charts is one of the most useful features in Excel. Charts allow you to illustrate your workbook data graphically, which makes it easy to visualize comparisons, trends etc. This feature is widely used for data representation.
How to prepare Charts?
This following steps required for creating chart.
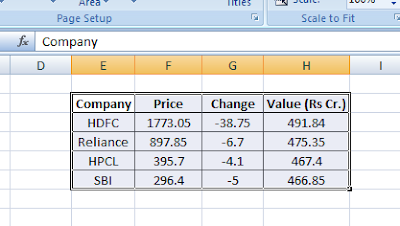
1. Select the data range.
2. Go to Insert tab and select a type of Chart.
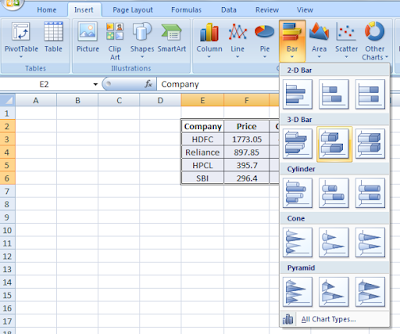
3. Insert any type of Chart by clicking on it.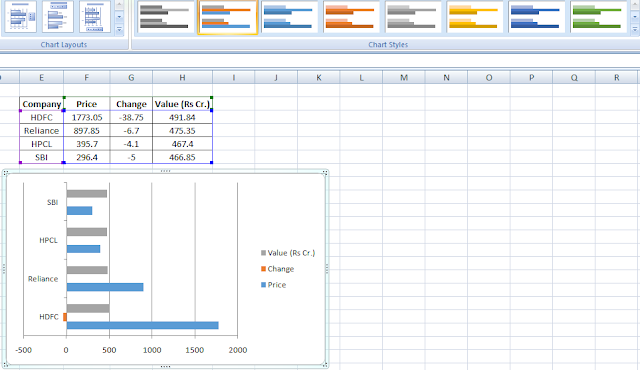
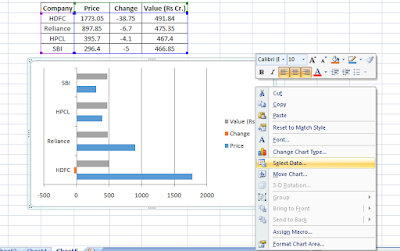
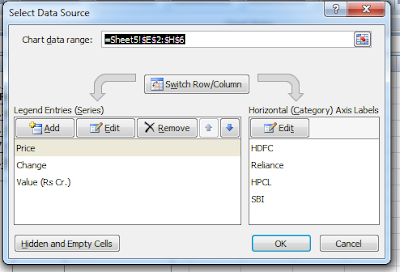
4. Right click on chart and click on select data to change data of chart.
What are the types of Charts?
Chart Types:
Basic chart types which are available in all version of Excel are
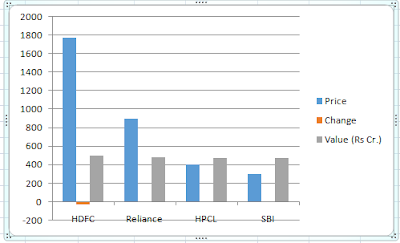
A. Column Chart
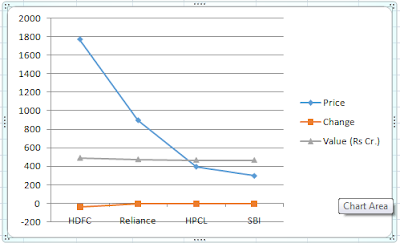
B. Line Chart
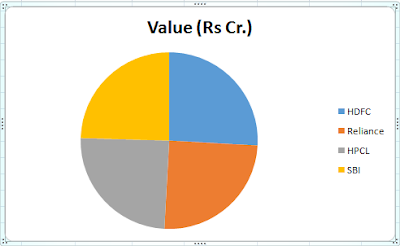
C. Pie Chart
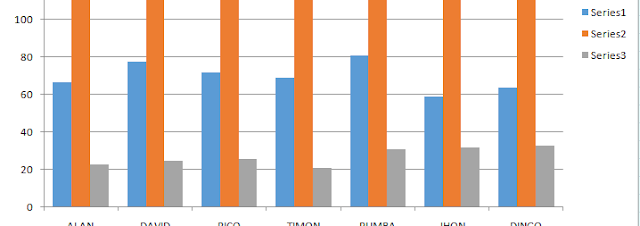
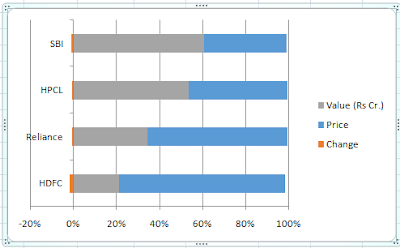
D. Bar Chart
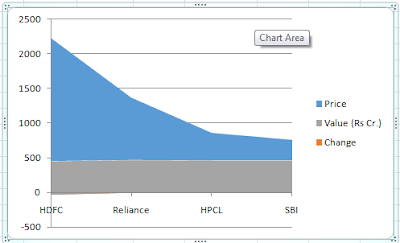
E. Area Chart
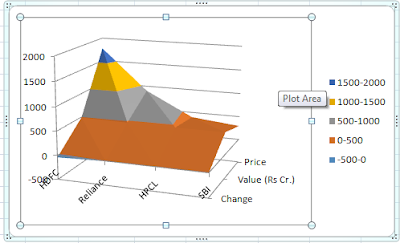
F. Surface Chart
Some important lessons about Charts
Lesson#54: Charting practice with stock data
Lesson#55: Some examples where Pie Chart can be used
Lesson#58: How to analyse data with Pivottable
Lesson#89: Example of bar chart with life expectancy data
Lesson#94: You can add many chart data in same area
Lesson#95: How to VLOOKUP chart from a drop down menu in Excel
Lesson#96: How to HLOOKUP chart from a drop down menu in Excel
Lesson#97: Examples for column and bar chart