What is PivotTable?

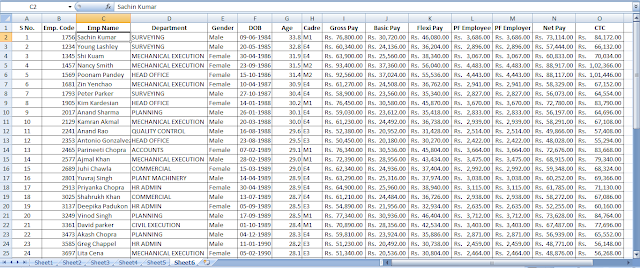
Here we will learn how to make Data analysis with PivotTable. It is one of the best features of Excel to analyze data. Here I have an example of employee database. Let’s see how can we apply PivotTable and what is that?
How to insert a PivotTable?
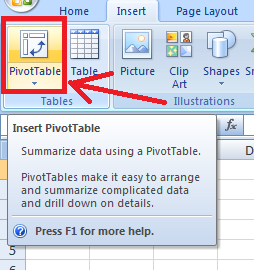
Just in another sheet I have clicked on Insert> PivotTable
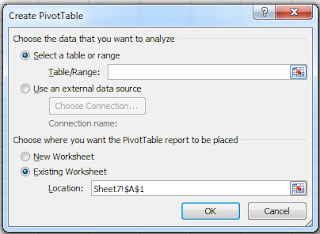
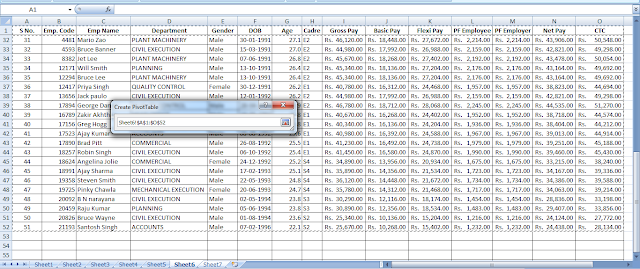
Selected the Table/Range form data table.
Let’s clear the concept with an example
Here it shows the PivotTable and it’s tools.
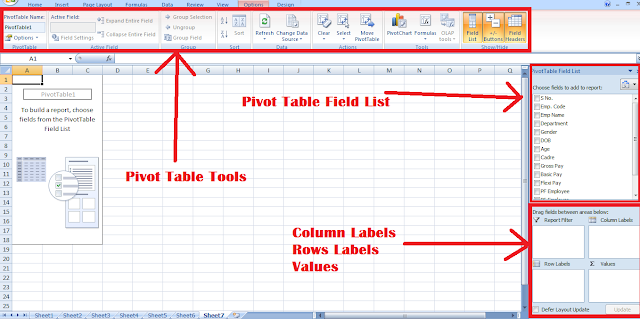
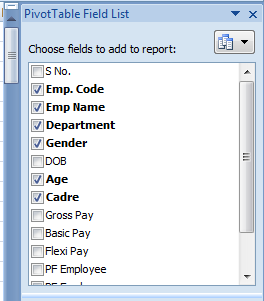
From PivotTable Field List we have to choose which are fields we want be included in PivotTable.
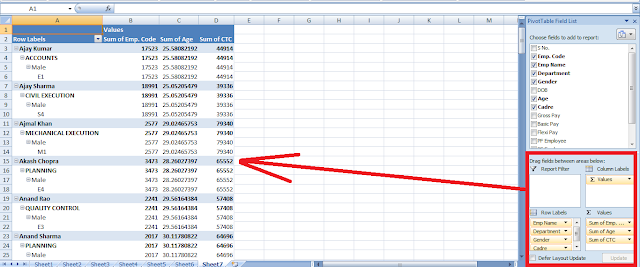
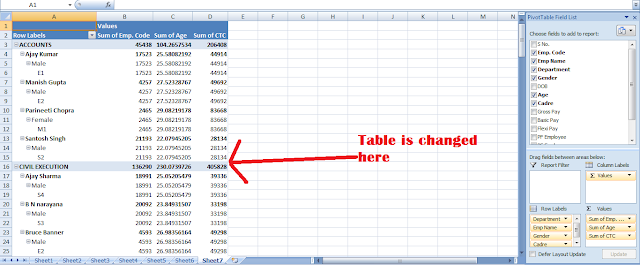
We have put those fields into Column Labels, Values, Row Labels to arrange the table.
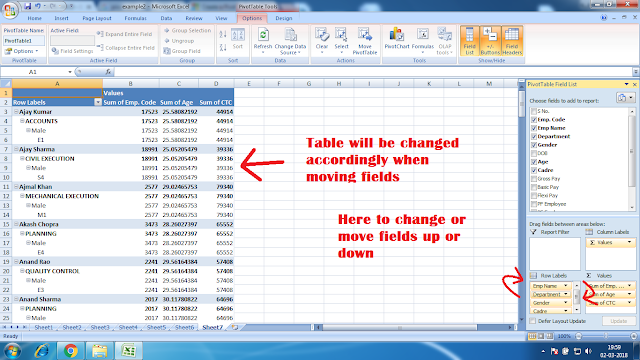
We can move fields from up to down or from Row Labels to Values or Column Labels or vice versa by dragging them. PivotTable will be changed accordingly.
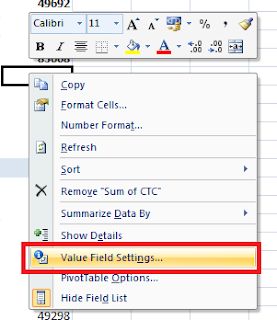
Right clicking on PivotTable shows many options. One of them is Value Field Settings which is very important.
Data analysis with PivotTable
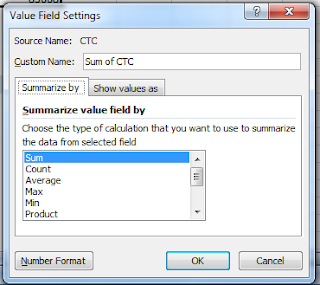
Here we can set values to summarized by Sum, Count, Average, Max, Min, Product, Count Numbers, StdDev, StdDevp, Var, Varp.
Data analysis with PivotTable
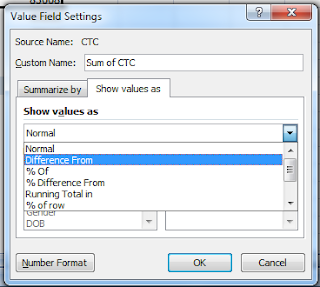
Here we can show values as Normal, Difference From (Other fields), % Of (Other fields), % Difference From (Other fields), Running Total In (Other fields), % of row (Other fields), % of column (Other fields), % of total, Index
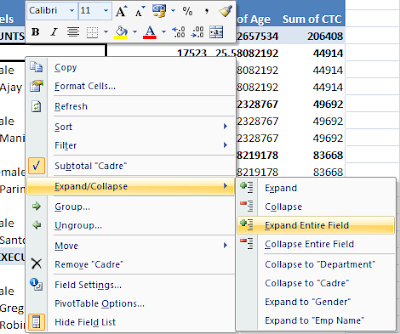
Right clicking on PivotTable shows you option Expand/Collapse where you can expand or collapse fields.