Creating charts in Excel is a powerful way to visualize data and communicate insights effectively. However, working with Excel charts can sometimes be frustrating, especially when you encounter issues related to data source problems. In this expert-level guide, we’ll delve …

Lesson#225: Fixing Excel Chart Data Source Problems: An Expert Guide Read more »

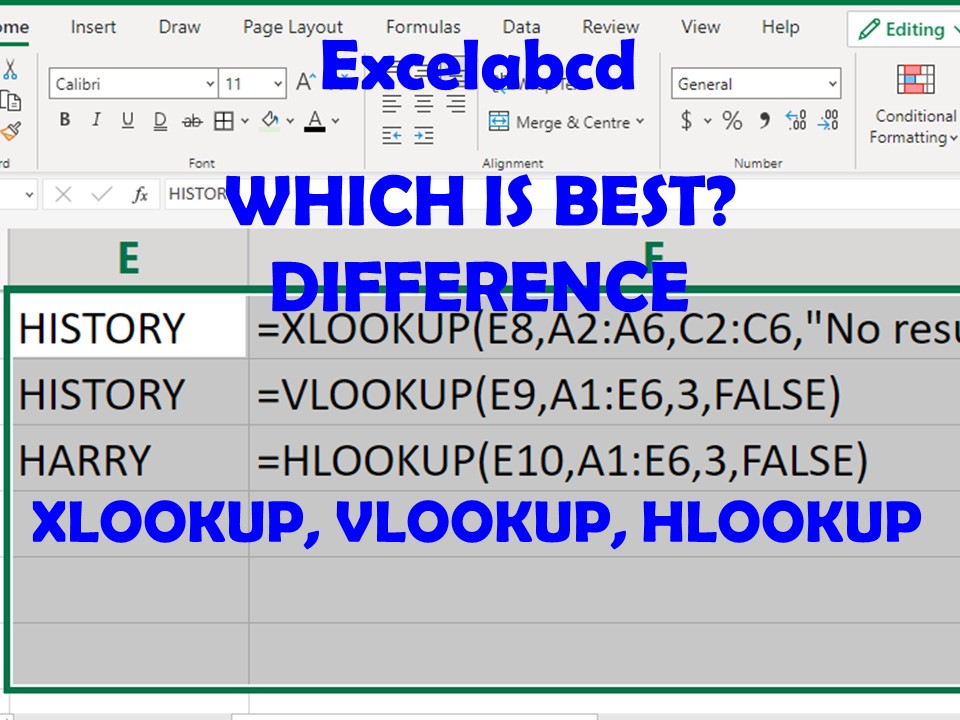
Hello Reader! Welcome to my other post on Excelabcd. Microsoft Excel has introduced a new function on Excel 365 and Excel online version. Which is the Excel XLOOKUP function. Which is the DAD of all LOOKUP functions. Here we shall …

Lesson#156: XLOOKUP vs VLOOKUP in Excel. Which one is better? Read more »

Here I have to make a parent Gantt chart from a data table. It is a Gantt chart summary as per BOQ (Bill of Quantities) Item and RA Bill No. wise. This bar chart will be followed with chainage value …

Lesson#49: Make a parent Gantt chart from a data table Read more »

The INDEX function returns a value or reference of the cell at the intersection of a particular row and column, in a given range. Syntax of this function is INDEX(array, row_num, [column_num]) The array is required, If the array contains only one …

Lesson#41: Combination of INDEX and MATCH function is better than any other lookup function Read more »