Lesson#97: Examples for column and bar chart

Here I will show you some examples for column charts and bar charts as well. Column charts can be used to represent data or values graphically which are arranged in categories.
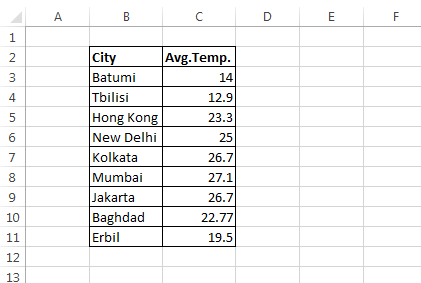
Here we are having a whole year of average temperature data for some cities. Making a column chart is very easy with it.
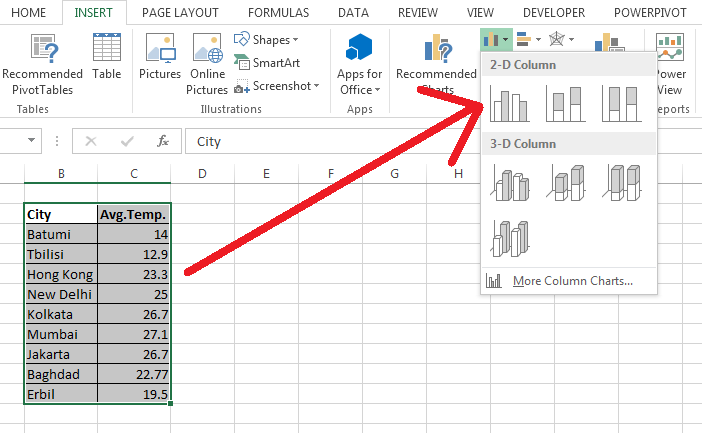
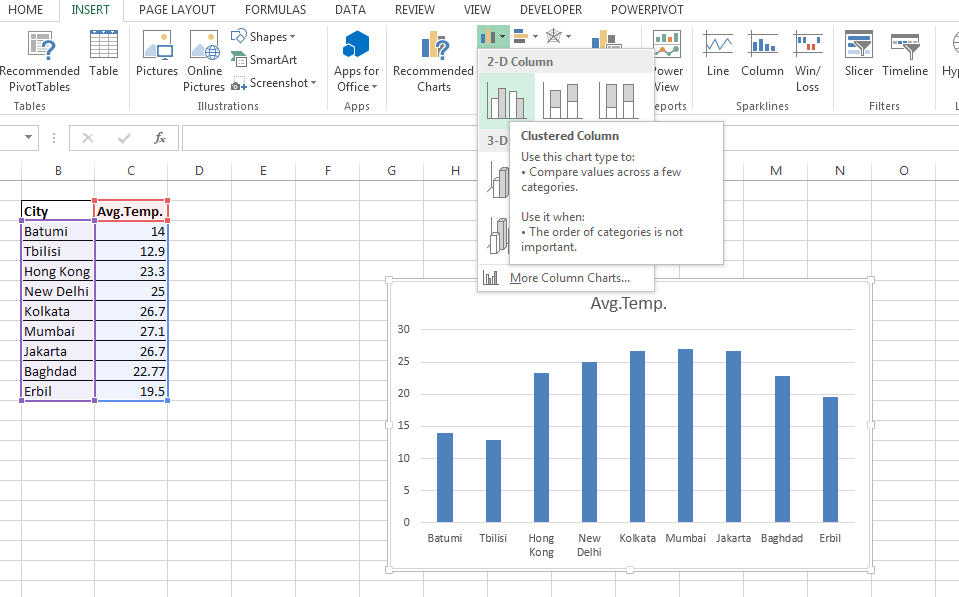
You have to select the cells which contain the data table and go to Insert>Charts>Column Chart
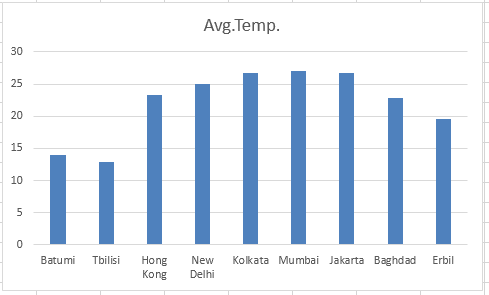
This is a column chart with the average temperature data of cities.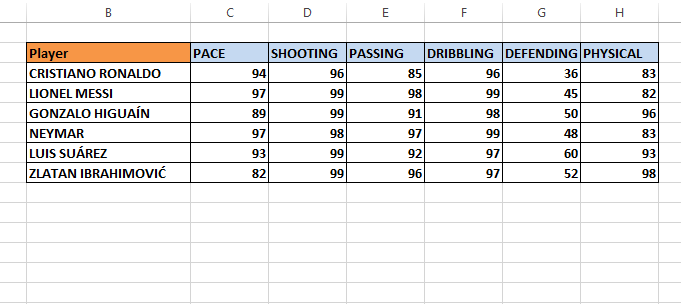
Now we have another example of football players’ skills data got from Fifa video games. In this example, we have more than one category for each name.
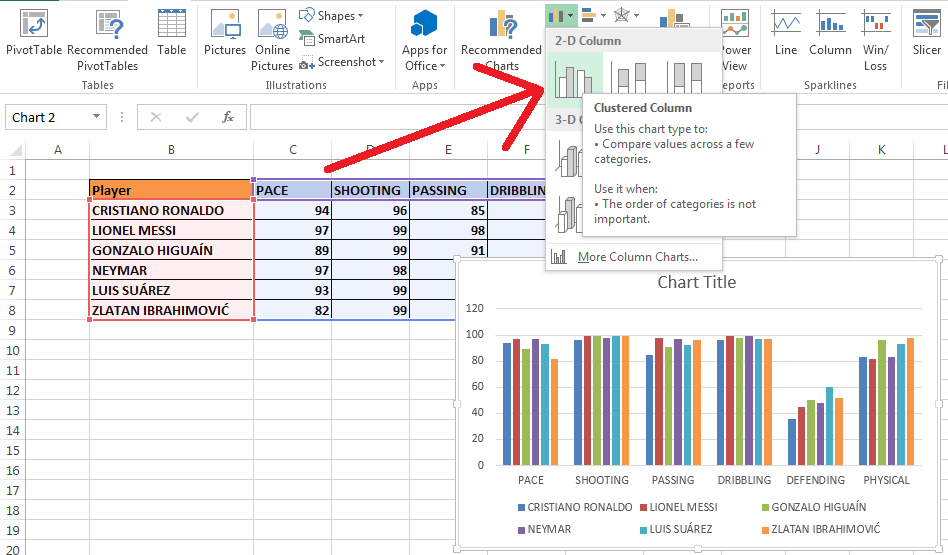
Here also it is the same that you have to select the whole table and go to Insert>Charts>Column Chart
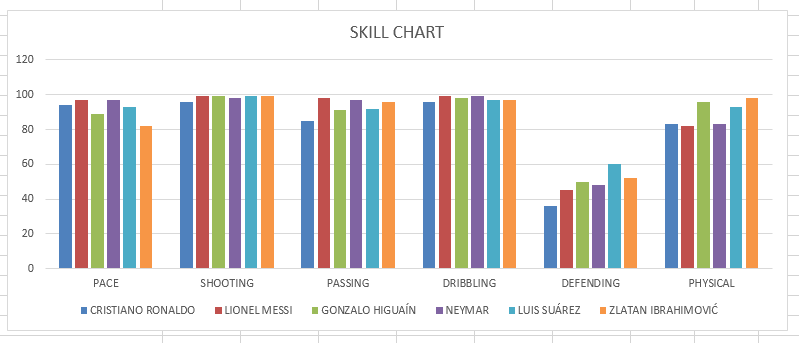
This chart appears like this shown in the above picture. Different colors of columns for each skill are arranged in groups for every player. So these are typical examples of a column chart.
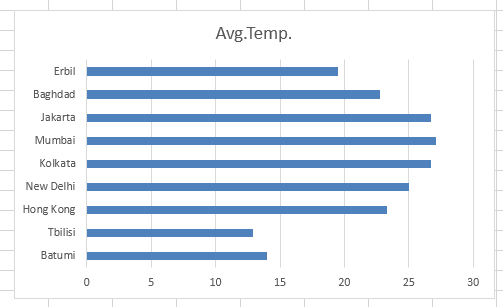
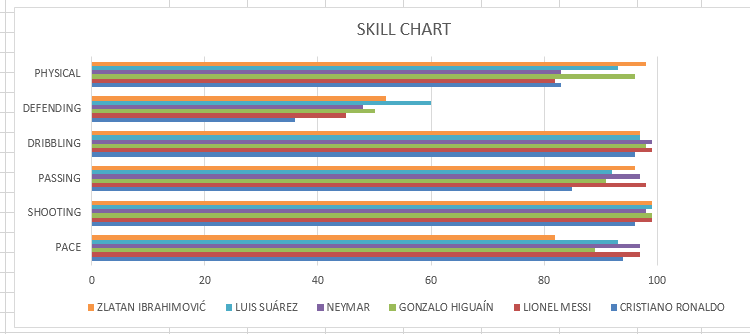
In the same way, you can easily make a bar chart also. You have selected the data table and Inserted a bar chart like the above pictures.
Hi! I am Pushpendu. I am the founder and author of Excelabcd. I am little creative person, blogger and Excel-maniac guy. I hope you enjoy my blog.