Lesson#54: Charting practice with stock data

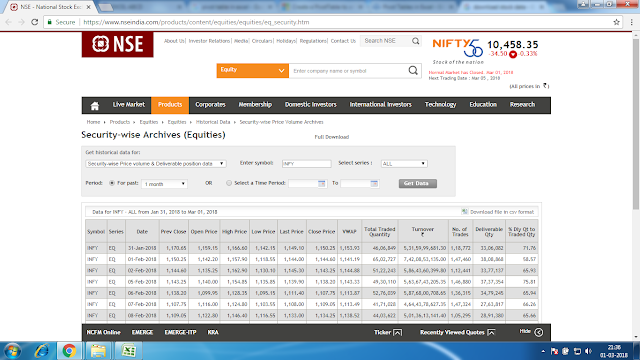
Let’s have some charting practice in excel. I have downloaded last month’s INFOSYS stock data from the National Stock Exchange website in CSV format.
Now I will go to Insert>Charts>Other Charts>Stock>Volume-Open-High-Low-Close
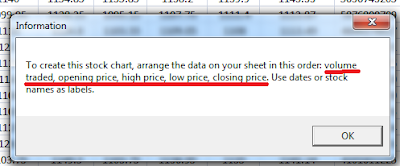
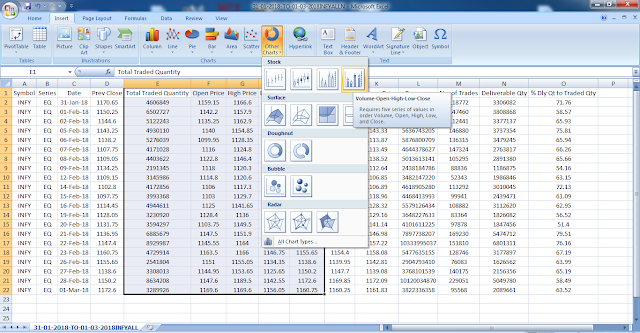
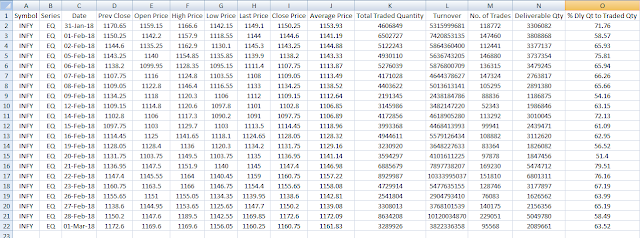
So I have arranged the data table in that order and selected five columns then Insert>Charts>Other Charts>Stock>Volume-Open-High-Low-Close
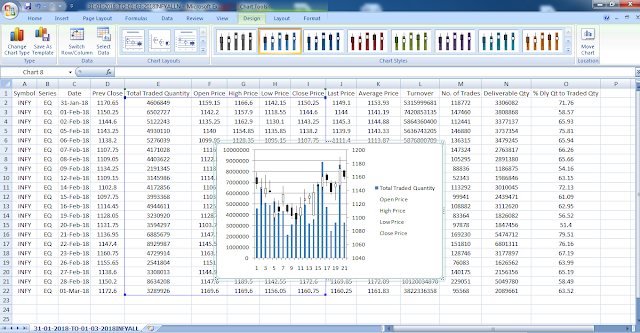
Then the chart will appear as it has shown in the picture above.
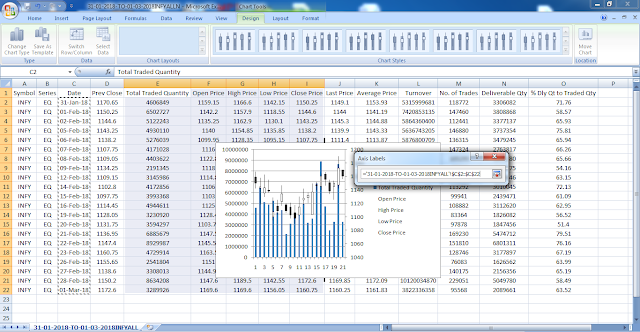
But it has to be changed a little. Date values should be shown on X-axis. For that right click on the chart, click on select data, Click Edit below Horizontal (Category) Axis Labels, and select the values under Date
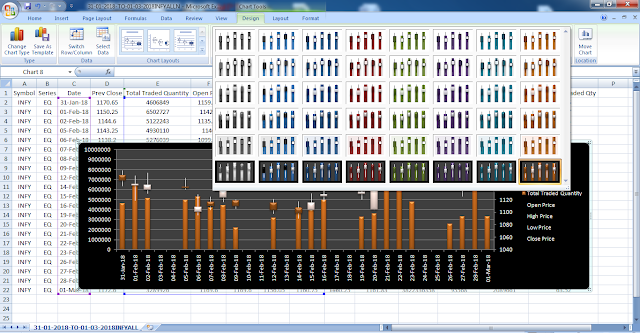
You can change the design of the chart from Chart Tools> Design
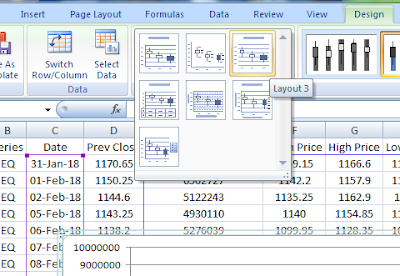
Or you can change the layout of the chart from Chart Tools> Chart Layouts
Hi! I am Pushpendu. I am the founder and author of Excelabcd. I am little creative person, blogger and Excel-maniac guy. I hope you enjoy my blog.