🔄 How I Built a Gann Square of 9 in Excel for Short-Term Trading Using 1-Hour Candles
If you are passionate about trading and love working with Excel, this article is for you. Here, I’m going to walk you through the step-by-step logic of how I created a Gann Square of 9 tool in Microsoft Excel, specifically designed for short-term intraday traders using 1-hour candles.
This is not just any Square of 9 – this one is fully Excel-driven, automatically adjusts time with each row, skips weekends, and only counts active market hours. If you’ve ever wanted to blend Excel formulas with financial astrology or Gann techniques, you’ll love this.
⚡ Note: This article focuses on the Excel logic and automation. For the actual Gann Square of 9 implementation, support/resistance rules, and reversal zone strategy, please refer to my detailed article at Stocklord.in where I explain how to use this tool in real markets.
📈 Why Create a Gann Tool in Excel?
Most Gann tools available online are locked in black-box platforms or require heavy programming. But Excel gives us transparency and flexibility.
I created this Excel system because:
- I needed a time-based Gann model that works on 1-hour candles
- Wanted to avoid after-market hours and weekends
- Wanted full control to tweak logic or backtest
- And honestly—I just love Excel!
🔧 Core Excel Requirement: A Dynamic Time Series Engine
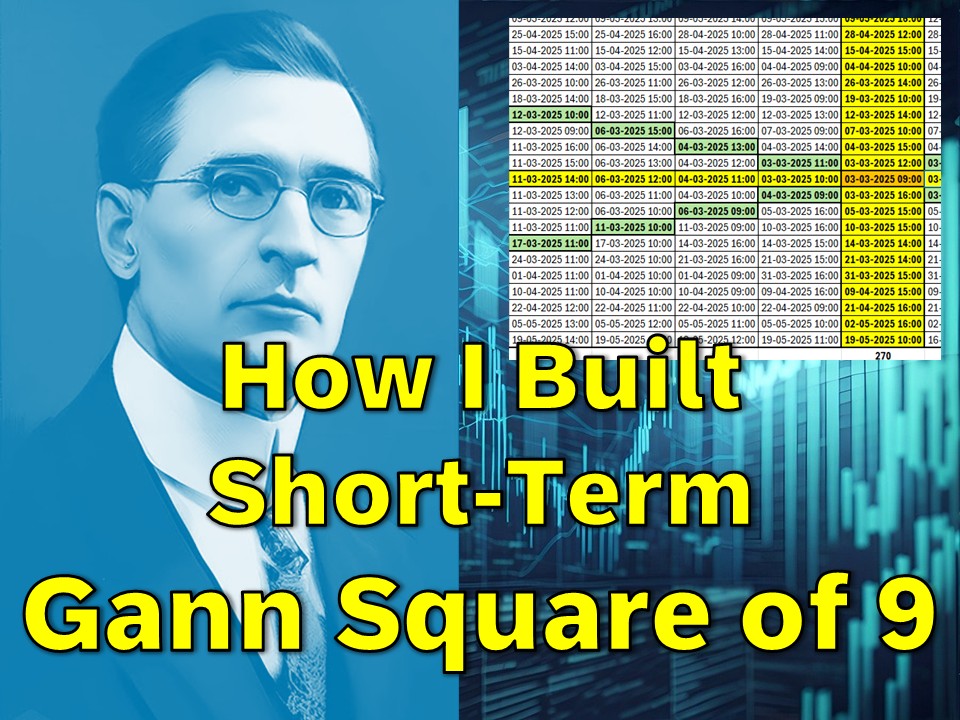
The entire system runs on a column where each row represents a new 1-hour candle, only within trading hours, and automatically skips to the next day or Monday (if it’s Friday).
This time engine is essential for applying Gann calculations to price-time squares, and is built using a single Excel formula.
🧠 The Formula That Makes It All Work
excelCopyEdit=IF(WEEKDAY(IF(HOUR(L13+"01:00")>16,L13+"17:00",L13+"01:00"),1)=7,L13+"66:00",IF(HOUR(L13+"01:00")>16,L13+"17:00",L13+"01:00"))
Let’s understand what this means, piece by piece.
✅ Assumption:
- Cell
L13contains a timestamp, e.g.08-Apr-2025 15:15 - You want the next cell (L14) to give you the next valid 1-hour candle during market hours (usually 9:15 AM to 3:30/4 PM)
- You don’t want weekend candles
🔍 Breaking Down the Formula in Easy Terms
Let’s decode it.
1️⃣ L13 + "01:00"
We’re starting by adding 1 hour to the current timestamp.
If the last candle was at 2:15 PM, this becomes 3:15 PM.
2️⃣ IF(HOUR(...) > 16, L13 + "17:00", L13 + "01:00")
This checks if the new hour exceeds 4 PM (HOUR > 16).
- If it does, it means we’re outside trading hours.
- Instead of adding just 1 hour, we jump 17 hours ahead, taking us to next day’s 9:15 AM
For example:
iniCopyEditL13 = 08-Apr-2025 16:15 → Adding 1 hour → 17:15 (outside market hours) → Add 17 hours instead → Lands at 09-Apr-2025 09:15
3️⃣ WEEKDAY(..., 1) = 7
Now the big one: This checks whether the new time lands on Saturday.
WEEKDAY(date, 1)returns7for Saturday.- If it’s Saturday, trading is closed. We want to skip to Monday 9:15 AM.
- So we add 66 hours (48 hrs for the weekend + 18 hrs to reach Monday morning).
Example:
sqlCopyEditL13 = 05-Apr-2025 15:15 (Friday)
→ Add 1 hour = 16:15
→ Add 17 hours = Saturday 09:15 AM
→ Not valid → Add 66 hours → Monday 9:15 AM
✅ Summary of What the Formula Does
| Condition | Action |
|---|---|
| Time is within market hours | Add 1 hour |
| Time exceeds 4 PM | Add 17 hours (next day market) |
| Lands on Saturday | Add 66 hours (to Monday 9:15 AM) |
This one formula keeps your time column clean, consistent, and market-aware. Perfect for building a real-time trading model.
🧩 How It Powers the Gann Square of 9 Tool
Once you have the correct hourly timestamps, you can align it with your Gann Square calculations.
Here’s how I use it:
- Each timestamp powers a row in my Gann table
- I map price vs time using Square of 9 rotation logic
- I mark angles (0°, 45°, 90°, etc.) as potential reversal zones
- I plot the Gann angles against real prices for intraday trading
📘 Where to Learn the Full Gann Setup?
I’ve written a detailed article on my stock market blog Stocklord.in that explains:
- What is the Gann Square of 9?
- How I extract support and resistance using angles
- How I determine trend reversal points
- How I use this exact time logic in Excel to build short-term setups
📎 Read it here:
👉 How to Trade Short Term Using Gann Square of 9 (Stocklord.in)
🧮 Sample Excel Output Table (Conceptual)
| Time | Gann Angle | Price Projection | Signal |
|---|---|---|---|
| 08-Apr-2025 09:15 | 0° | 22250 | – |
| 08-Apr-2025 10:15 | 45° | 22320 | Watch closely |
| 08-Apr-2025 11:15 | 90° | 22400 | Potential top |
| 08-Apr-2025 12:15 | 135° | 22350 | Support alert |
Each row is based on the hourly progression formula we discussed.
💡 Advanced Excel Tips
Once this base logic is working, here’s how you can expand it:
- Auto-highlight weekends using conditional formatting
- Add Gann angle calculations in adjacent columns
- Use dynamic charts to plot price vs Gann time levels
- Add alerts or triggers for certain angle matches
- Integrate with live price feeds (using Power Query or API)
📁 Want This as a Template?
Download this format from here. I am giving you for free. Don’t forget to share with others.
🔚 Final Thoughts
Excel isn’t just for finance reports or dashboards—it can be a powerful trading lab if you understand how to work with time, logic, and structure.
This formula is just the beginning. You can use this to:
- Build your own Gann engine
- Merge with RSI or Bollinger logic
- Plot hourly energy points
- Create unique, testable trading systems
And when you’re ready to apply this in real trades, head over to Stocklord.in and read how I combine this Excel logic with Gann Square of 9 analysis for short-term forecasting.
📌 Stay connected with ExcelABCD.co.in for more:
- Excel tricks for finance
- Stock market automation in Excel
- Excel-based technical analysis tools
- And upcoming downloadable templates!
Hi! I am Pushpendu. I am the founder and author of Excelabcd. I am little creative person, blogger and Excel-maniac guy. I hope you enjoy my blog.