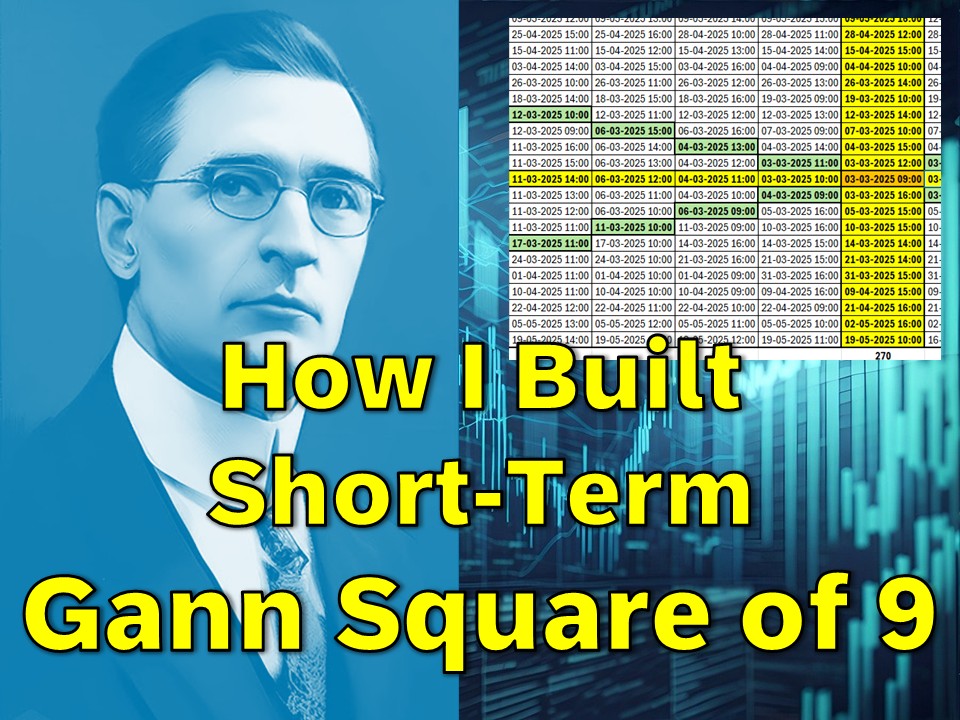
The Gann Square of 9 is a fascinating tool used in financial markets for forecasting and price analysis. It’s based on mathematical and geometric principles, making it a favorite among traders and technical analysts. In this article, we’ll show you …

Creating a Simple Gann Square of 9 in Excel: Step-by-Step Guide Read more »

Managing a stock portfolio is essential for any investor, and creating a stock portfolio tracker in Excel is one of the simplest and most effective ways to do so. Whether you’re a beginner investor or an experienced trader, Excel offers …

How to Create a Basic Stock Portfolio Tracker in Excel Read more »

Here are some steps you can follow to analyze stock market data in Google Sheets: Note that the specific steps and tools you use to analyze stock market data in Google Sheets will depend on your goals and the type …

Lesson#172: How to analyze stock market data in Google Sheets? Read more »