📐 How to Make the Intraday Gann Square of 9 in Excel – Step-by-Step (with Free Template)
Welcome back to ExcelABCD.co.in, your home for Excel-powered trading tools and automation tricks!
In this post, I’m going to show you how I created the Intraday Gann Square of 9 (1-Minute Format) using Excel formulas, referencing a spiral matrix centered around a specific time point, and then automatically generating 1-minute increments across the entire Square.
By the end of this post, you’ll be able to:
- Create your own Gann Square of 9 based on intraday time
- Use it to predict turning points in stocks, crypto, or commodities
- Download the exact Excel format I use — for free!
📌 For those who want to learn how to use this tool in real trading, I’ve shared the full strategy with RSI, MACD, and support/resistance levels on my technical trading blog:
👉 Read here on Stocklord.in »
🧠 What Is This Intraday Square of 9?
This is a time-based version of the traditional Gann Square of 9. Instead of using prices or dates, this model uses 1-minute candle times in a spiral formation.
Here’s how it works:
- Pick any strong low or high point of the day on the 1-minute chart (say, 09:24 or 14:02).
- Place that time in the center cell of your Square.
- The Square will then automatically fill out surrounding cells by +1 minute steps spiraling outward.
- The important angles (0°, 45°, 90°, etc.) predict reversal or consolidation points.
💡 Combine it with RSI, MACD, and support/resistance for better accuracy.
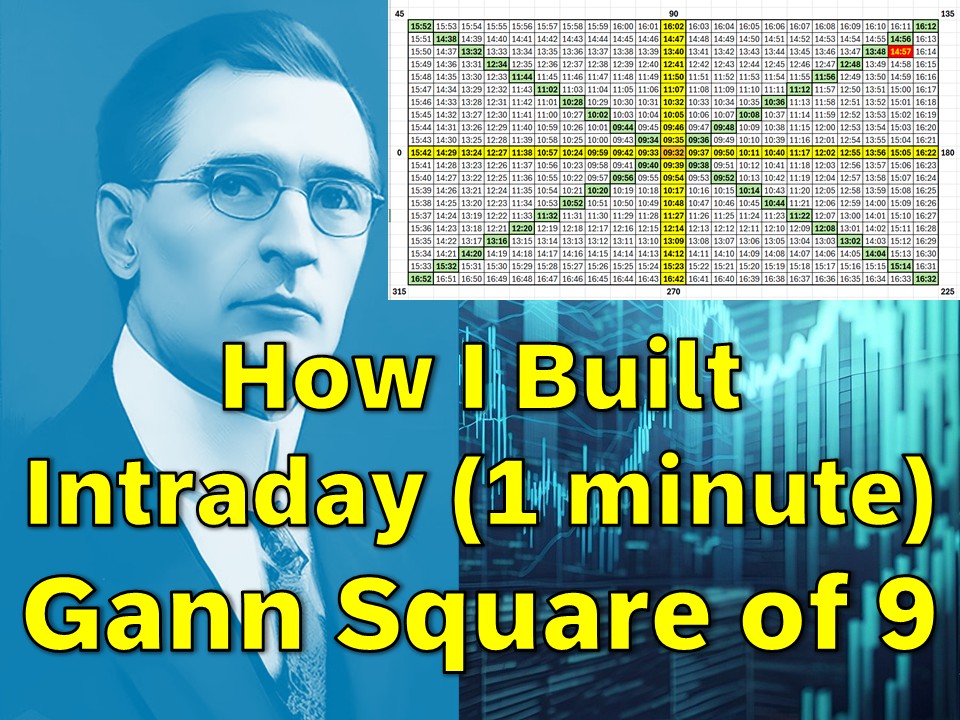
🖼️ Format Breakdown (See Attached Image)
Here’s a preview of the actual Square format you’ll be building (you already uploaded it — great!):
🧭 Gann Angles Marked:
- 0°, 45°, 90°, 135°, 180°, 225°, 270°, 315°
- Each angle represents a major vibration path—highlighted using different colors (yellow, green, light green, red, etc.)
🔁 Spiral Center:
- In this image, “11:38” is the center. You could change it to any key minute like 09:24 or 14:02.
🕘 Cell Increments:
- Each adjacent cell increases by 1 minute.
- Formula auto-adjusts across the entire square.
🛠️ How to Make This in Excel
✅ Step 1: Center the Time
Pick any time and place it in your center cell (example: M13):
11:38
✅ Step 2: Formula to Add 1 Minute
For the next cell, apply:
=M13 + TIME(0,1,0)
This adds 1 minute to the previous cell.
Apply this across the Square using spiral logic (manually or via VBA).
✅ Step 3: Highlight Gann Angles
Use conditional formatting or manual coloring for:
- Yellow → 0°, 90°, 180°, 270° (key turning points)
- Green shades → 45°, 135°, 225°, 315°
- Red → Extreme reversal zones
You can color these cells to instantly visualize critical time points during live trading.
⚙️ How to Use It for Trading
Head over to my post on Stocklord.in where I explain the practical strategy in detail:
- Use it on 1-minute chart of any asset (Stock, Crypto, Commodity)
- After the market opens, identify a significant low/high
- Place that time in the center
- Watch for reactions near time angles (0°, 45°, 90°, etc.)
- Confirm reversals using RSI, MACD, and S/R levels from Gann
👉 Read the full usage guide on Stocklord.in »
📥 Download the FREE Excel Format
🎁 I’m giving away this beautifully structured Square of 9 template for free to all ExcelABCD readers!
🔗 Download here:
(Make sure to allow macros if using automated spiral fills.)
🎯 Final Thoughts
This tool is powerful when used with discipline. You’re essentially combining Gann’s time cycle theory with modern indicators to trade efficiently.
| Element | Use |
|---|---|
| Center Time | Based on key reversal candle |
| Spiral Logic | Builds Gann pattern |
| Angle Highlight | Spot time-based reversals |
| RSI/MACD Support | Adds indicator confirmation |
🗣️ Need Help?
If you’d like:
- A VBA macro to auto-fill the spiral
- Advanced versions for 5-min or hourly candles
- An automated dashboard
Comment below or message me. I’ll be happy to upload more tools at ExcelABCD.co.in.
Thanks for your support — and happy trading!
Hi! I am Pushpendu. I am the founder and author of Excelabcd. I am little creative person, blogger and Excel-maniac guy. I hope you enjoy my blog.