Lesson#60: Excel shows global warming

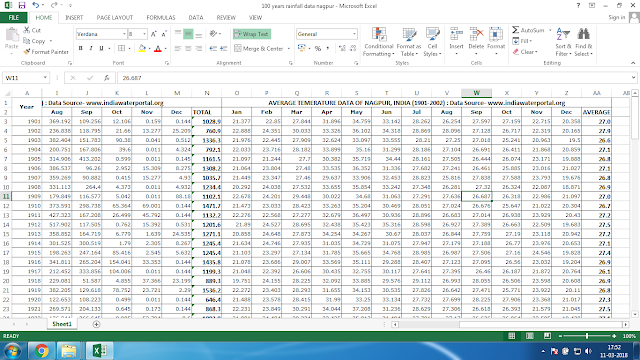
I have a column beside the precipitation data to make the sum of the whole year and beside the average temperature data, I have added another column to make the average temperature of the whole year.
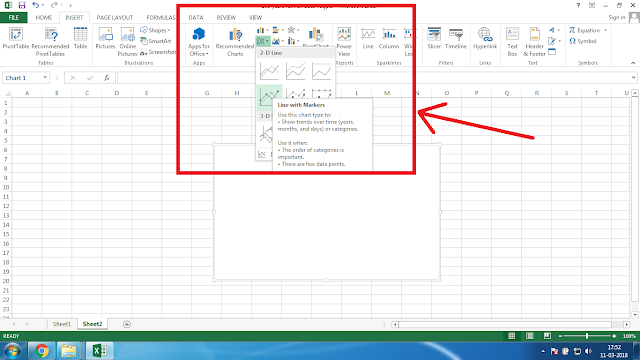
Now in another sheet, I have inserted a chart from Insert>Charts>
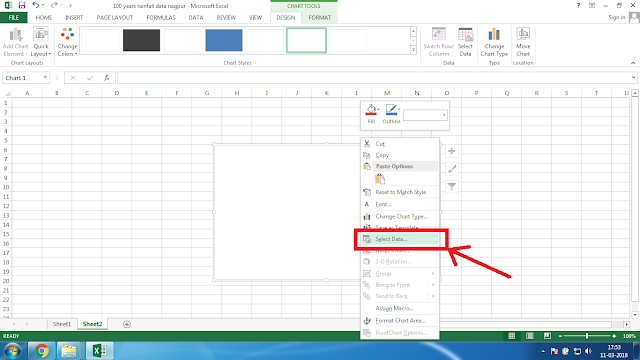
Now right clicked on the blank chart and clicked Select Data
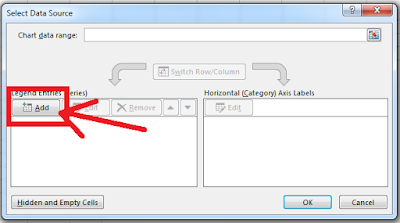
Clicked on the Add button like I have shown in the picture to select Legend Entries (Series)
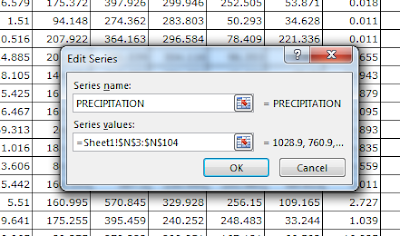
Entered the Series name PRECIPITATION and selected the total precipitation data column values in Series values.
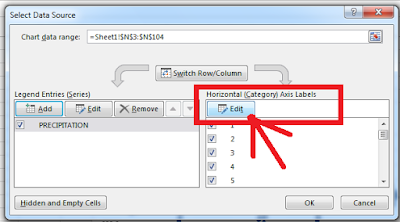
Now again right clicked on the chart and clicked Select Data. Clicked on the Edit button to select Horizontal (Category) Axis Labels.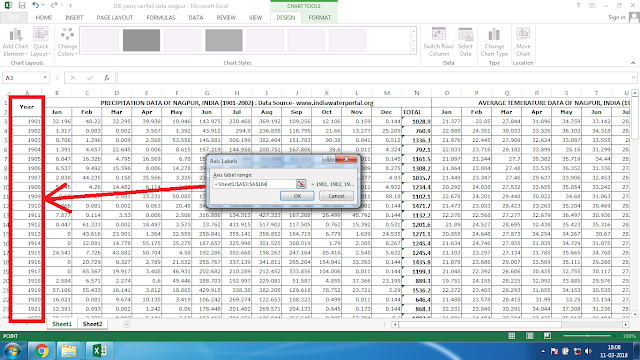
Selected the values in Year column in the Axis label range.
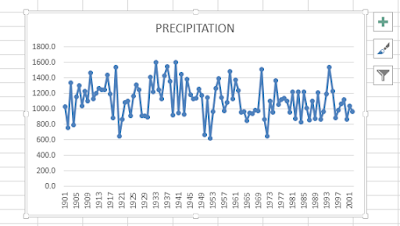
Now I have got the chart like this.
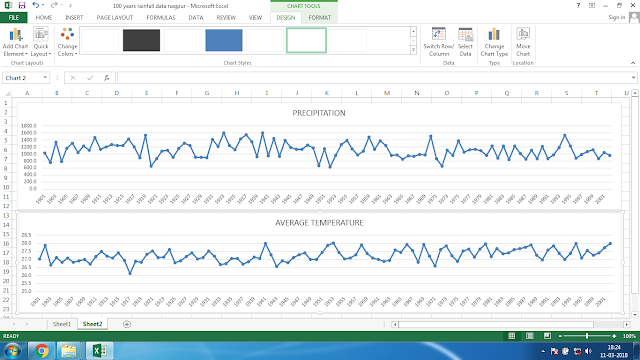
In the same way, I have made another chart for average temperature data.
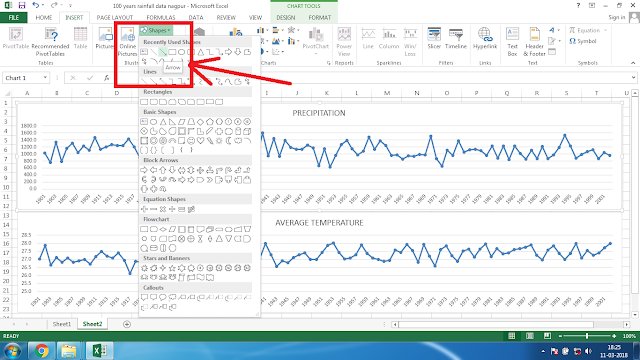
Now I will add a Shape (Arrow) to show the trend line.
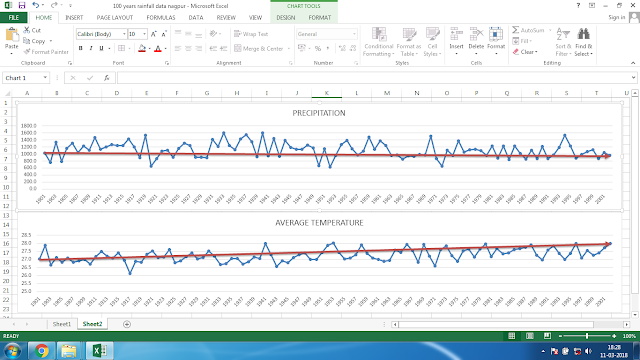
When I made the trend line on 100 years of data I found that the Precipitation trend line is inclining down and the Average Temperature trend line is inclining up. That’s a big matter to worry about for every living being on earth.
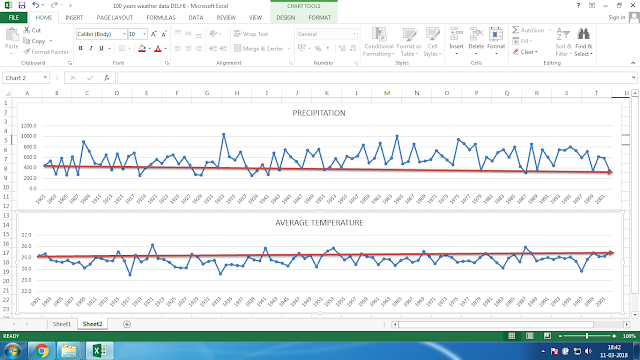
I have made another experiment on the 100-year data of Delhi, the capital of India. I found the same thing and that’s a matter to worry about.
Sharing my files in the below link.
Hi! I am Pushpendu. I am the founder and author of Excelabcd. I am little creative person, blogger and Excel-maniac guy. I hope you enjoy my blog.