Lesson#61: Making a semi analog clock with pie chart

OK friends! How is everyone? Now in this post, we will learn an unusual trick to make a semi-analog clock with Pie Chart. Let’s see.
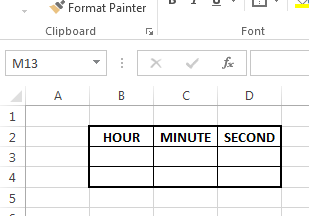
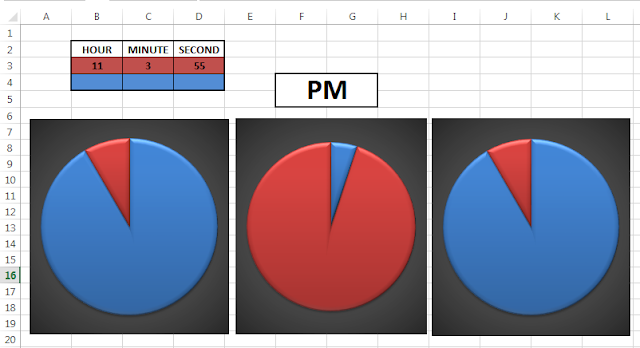
First I have made a 3X3 table for the hour, minute, and second of the current time.
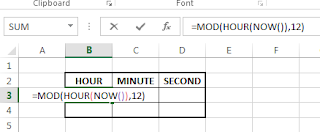
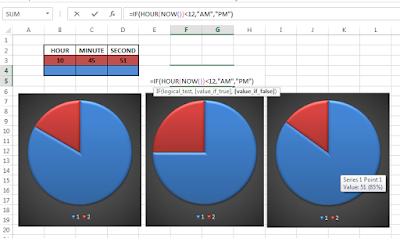
Here in this Hour cell, I have put this formula =MOD(HOUR(NOW()),12) to show the current hour in 12-hour format as it shows in the analog clock.
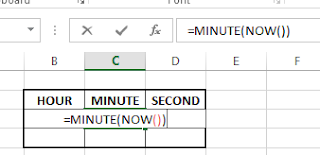
In the minute cell, I put the formula =MINUTE(NOW()) to show the minute of the current time.
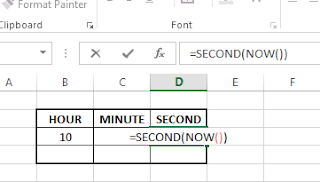
In the second cell I put the formula =SECOND(NOW()) to show the second of the current time.
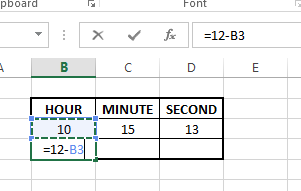
Now below them, I have added another row and that is the trick that shows the value 12-hour.
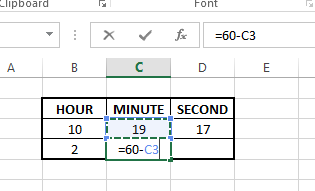
and 60-minute
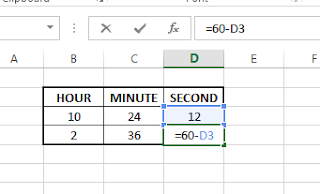
and 60-second
This value is required to make the pie chart.
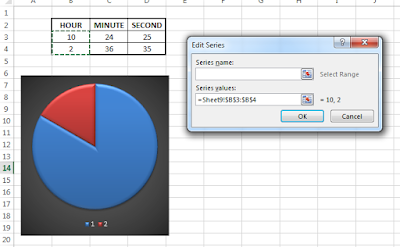
Now I am adding a pie chart of hours by selecting the hour value and 12-hour value as shown in the picture.
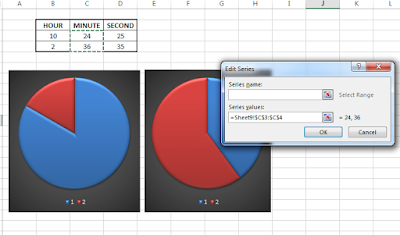
Now I am adding another pie chart of minutes by selecting the minute value and 60-minute value as shown in the picture.
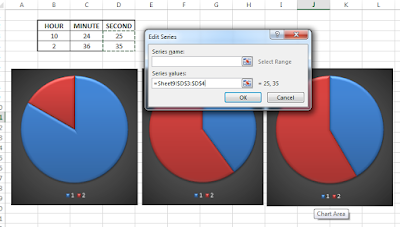
Added another pie chart of minutes by selecting the second value and 60-second value as shown in the picture.
Hi! I am Pushpendu. I am the founder and author of Excelabcd. I am little creative person, blogger and Excel-maniac guy. I hope you enjoy my blog.