Lesson#39: Cool tricks to make automatically updating Gantt chart

The purpose is to update the color chart automatically when I will change the value of the start date or end date. This color will show the duration of work graphically within the area below dates written horizontally on the left side.
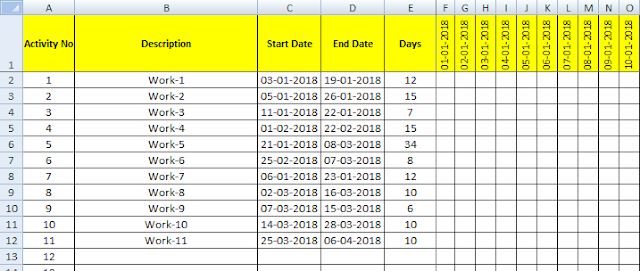
So I have put a simple formula within the area below dates written horizontally on the left side.
=IF(AND(F$1>$C2-1,F$1<$D2+1),”>”,””) which will generate the character “>” along the row within the area below dates written horizontally on the left side and only below those cells which come from the start date to end date.
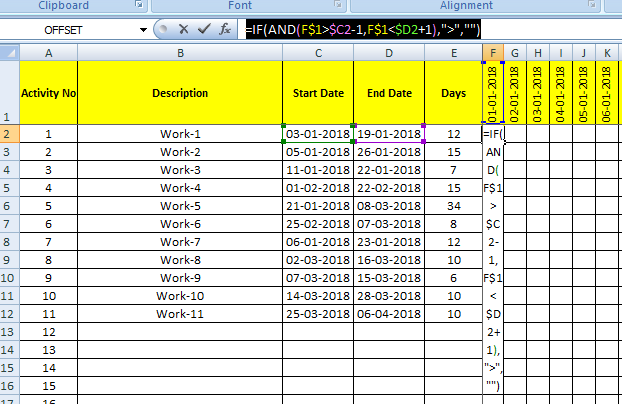
The formula is to be dragged throughout the area where the graphical chart is to be generated.
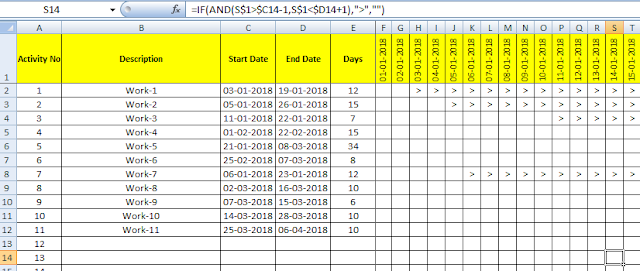
How this formula is working shown in the picture above. 90% of my work is completed in this step. The remaining work is to make conditional formatting within the area where I want to show the graphical chart.
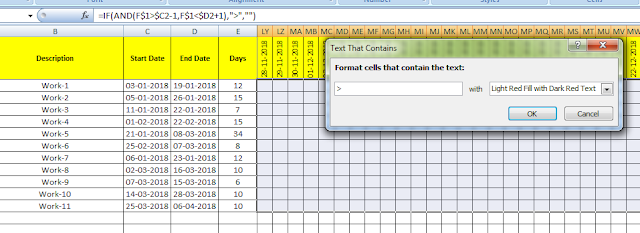
I have put a condition which will color those cells where it contains the text “>” and I have put the fill color and text color the same so the text won’t be visible only the color chart will be visible.
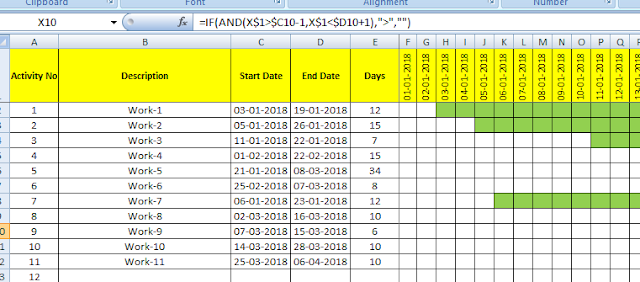
That’s pretty cool. I have given a download link for the file below. You can modify and make your chart by using this formula.
Download
Related Video Tutorials:
Leave a Reply