Lesson#93: Radar chart example with Cristiano Ronaldo
Hi! I am back with one more interesting post. Here I will show you a chart example. Yes, my friend charts are very very important things to know in Excel. Rather than wasting time let’s discuss a Radar Chart example on Cristiano Ronaldo’s skill set data which I found on the FIFA video game website.
What is a Radar Chart?
This is a spider web look-alike chart. It may be used to represent the values relatively from a center point.
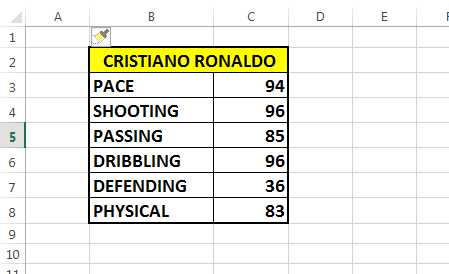
So here we can see in the above picture that Cristiano Ronaldo is having the following skill score out of 100. Now you have to represent these data with a Radar Chart.
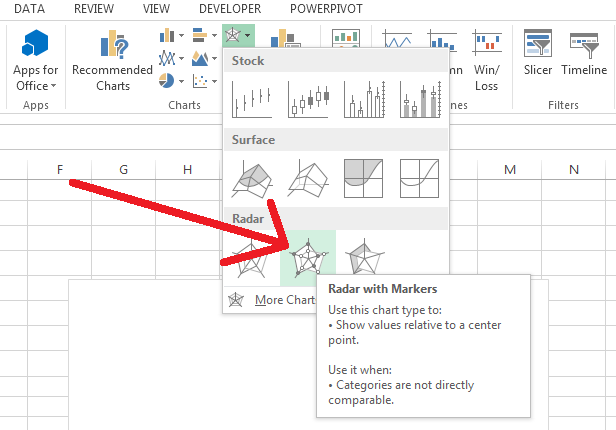
Now you have to go to Insert>Charts>Insert Stock, Surface or Radar Chart and then you insert a Radar Chart
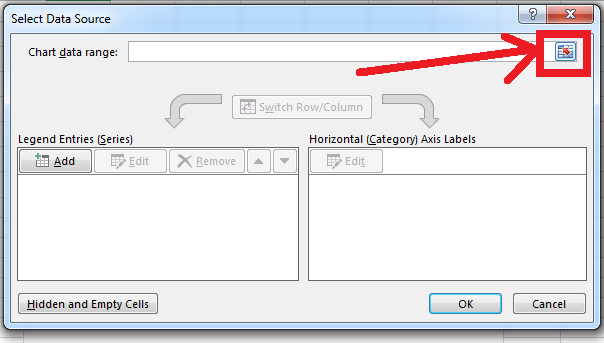
After inserting a blank chart in the worksheet you have to right-click on the chart and click on select data. Click that button beside the Chart data range which is shown in the above picture.
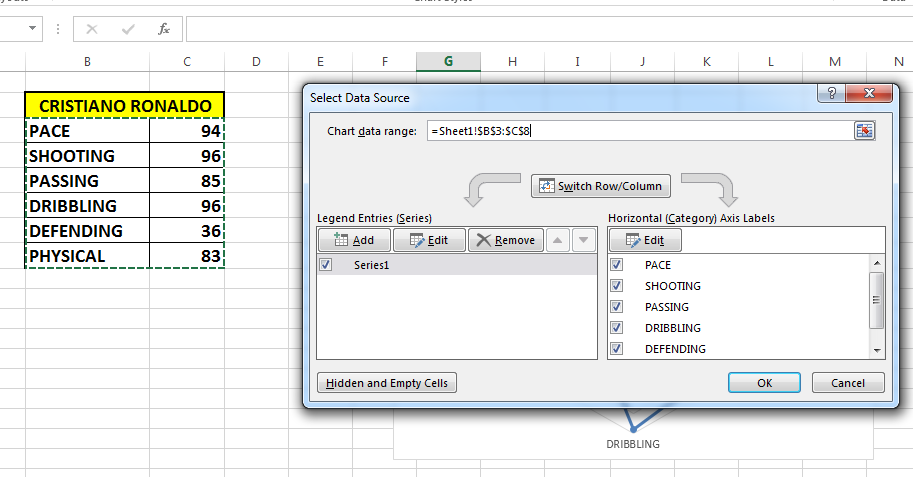
Now select these two columns with values and names and press OK. See the above picture.
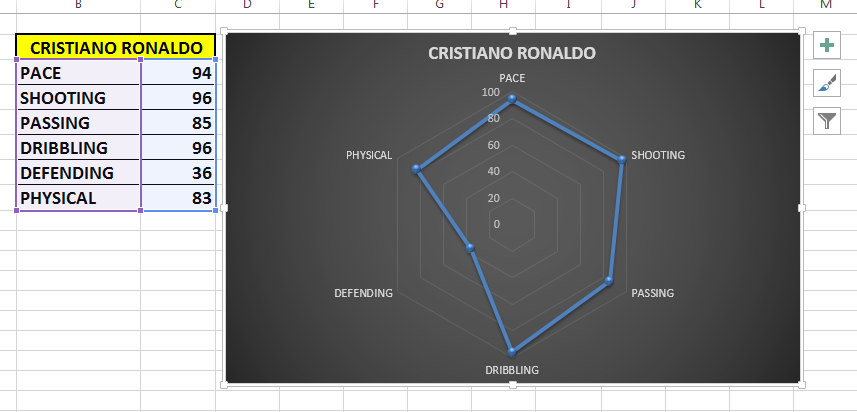
Now your chart is almost ready. You can format it by clicking on Chart Tools or clicking on the button beside the chart which looks like a brush.
Hi! I am Pushpendu. I am the founder and author of Excelabcd. I am little creative person, blogger and Excel-maniac guy. I hope you enjoy my blog.