Excel FREQUENCY function
Function FREQUENCY
Description Excel FREQUENCY function returns how many times the values occurs within a range which are equivalent or less than a supplied value. (Example: If you have an age data for a group of people then use FREQUENCY function to count how many people fall into different age groups)
Syntax FREQUENCY( data_array, bins_array )
data_array The original array of values for which the frequency is to be calculated.
bins_array An array of values, that specify the limits of the ranges that the data_array is to be split into.
Example:
Case:1
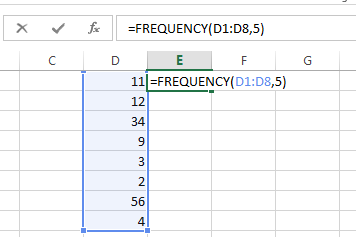
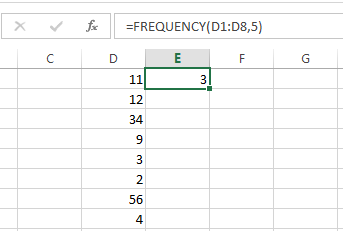
This above example means number of values in data_array which fall in the frequency of 5 are 3.
Like same =FREQUENCY(D1:D8,10)=4, =FREQUENCY(D1:D8,15)=6
Case:2
OK then we go to some complex example using array. Here I have age data of a group of people and I will see how many people falls in different age groups.
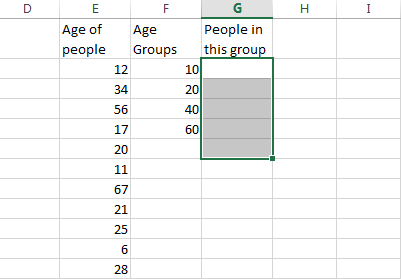
The data_array is under the head “Age of people”, the bins_array is under the head “Age Groups”, I have to show the returning array under the head “People in this group”.
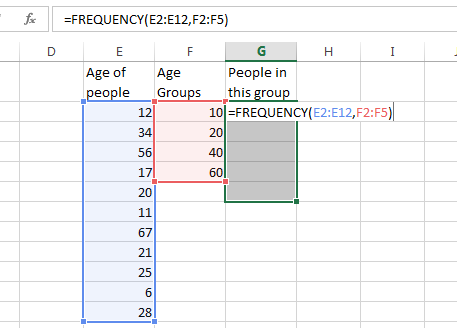
Then I am going to select one extra cell than bins_array and type the formula =FREQUENCY(E2:E12,F2;F5) and then hit Ctrl+Shift+Enter which will make like these adding curly brackets to formula {=FREQUENCY(E2:E12,F2;F5)}
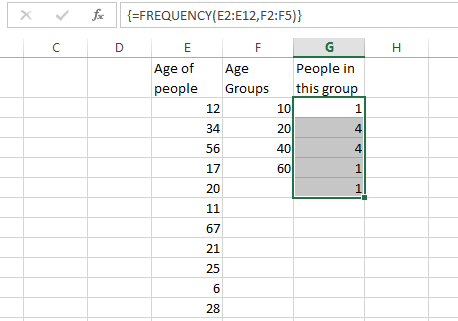
First result is 1 means only one person’s age is <=10
Second result is 4 means only four person’s age are between 11 and 20
Third result is 4 means only four person’s age are between 21 and 40
Fourth result is 1 means only one person’s age is between 41 and 60
Fifth result is 1 means only one person’s age is above 60
Usage Notes:
- To return multiple value take one more cell than bins_array and hit Ctrl+Shift+Enter